Open data
Finnish electricity price statistics
Two prices that are usually published apart: realised day-ahead prices for the Finnish price area from 2021, and a daily archive of what electricity contracts were actually offered to consumers. Every series is free to reuse with attribution and downloadable as CSV or JSON.
Suomeksi: Sähkön hintatilastot
Realised day-ahead prices for the Finnish price area as monthly and daily statistics and an hour-of-day profile. The series are available as CSV and JSON.
- Coverage
- 1 January 2021 – 12 September 2026
- Time covered
- 49,943 / 49,943 hours (100.000%)
- Price interval
- 60 min through 2026-06-14 · 15 min from 2026-06-15
- VAT treatment
- by era 24 % / 10 % / 25.5 % · negative: 0 %
- Page updated
- 13 September 2026, 16:38
Time series
Monthly day-ahead averages
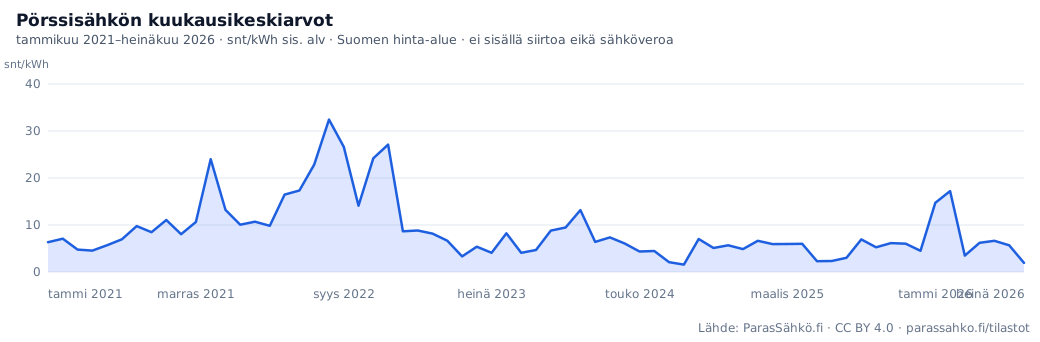
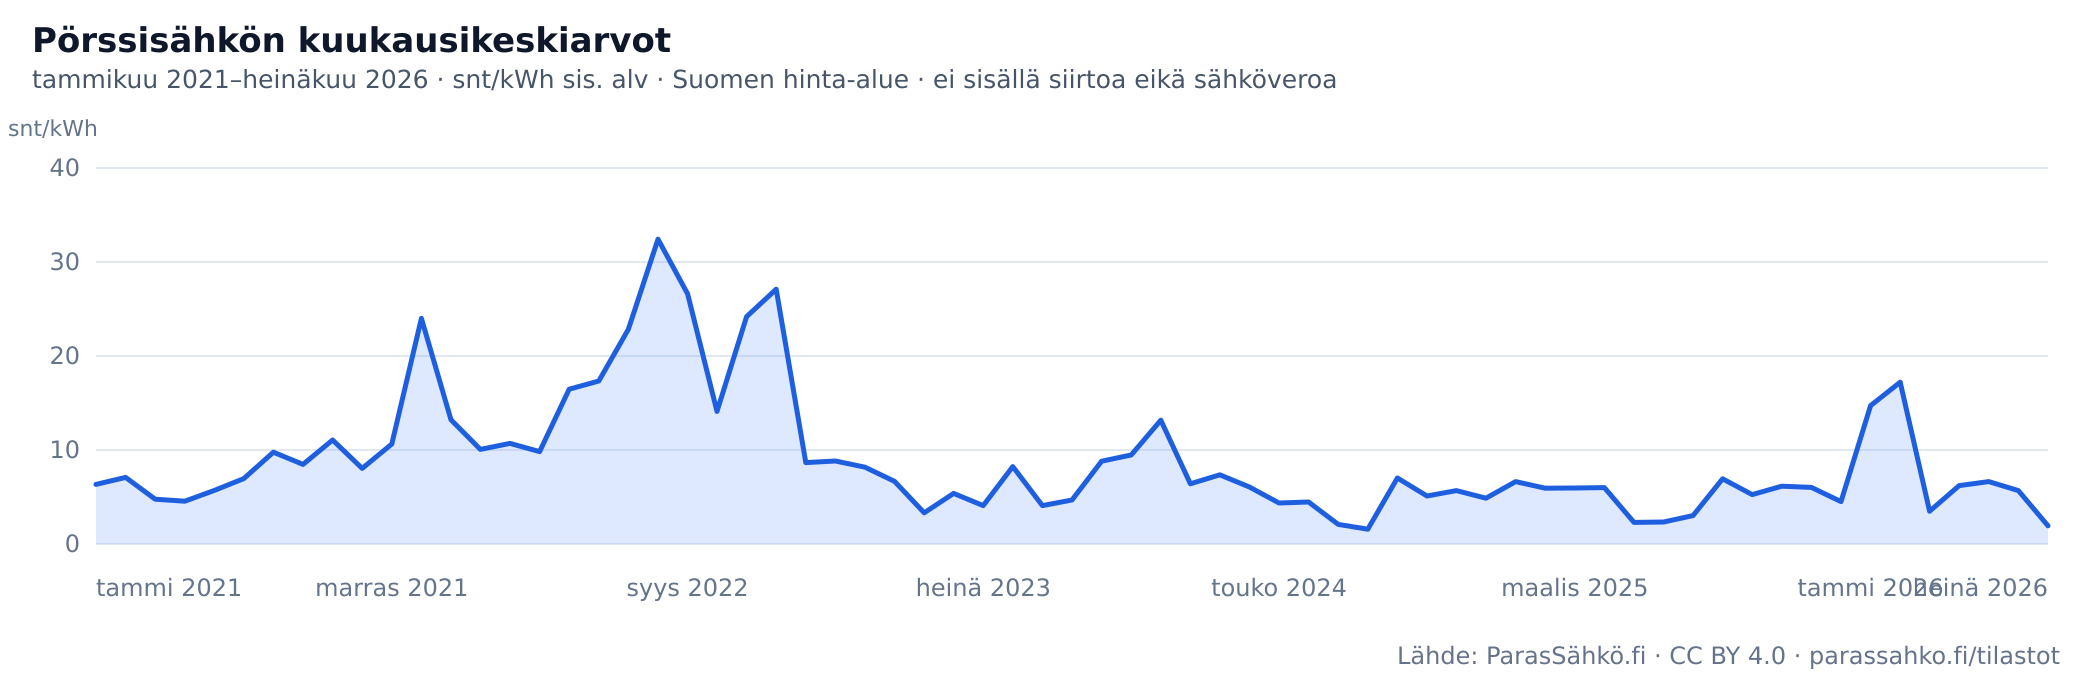
Each monthly figure is weighted by period duration rather than averaged across quotations. Across the whole record the most expensive month is August 2022 at 32.42 c/kWh and the cheapest August 2024 at 1.57 c/kWh; the extremes of the selected range appear under the pickers.
Selected range: 24 months. Most expensive February 2026 (17.22 c/kWh), cheapest July 2026 (1.93 c/kWh). Average across the range: 5.99 c/kWh.
| Month | Average | Lowest | Highest | Negative | Below 1 c | Time covered |
|---|---|---|---|---|---|---|
| September 2024 | 7.03 | -0.18 | 59.84 | 4.2 % | 31.5 % | 720 h |
| October 2024 | 5.10 | -0.30 | 62.76 | 16.1 % | 47.5 % | 745 h |
| November 2024 | 5.69 | -0.15 | 27.79 | 4.6 % | 35.0 % | 720 h |
| December 2024 | 4.87 | -0.10 | 61.99 | 3.0 % | 43.0 % | 744 h |
| January 2025 | 6.63 | 0.00 | 44.79 | 0.0 % | 28.8 % | 744 h |
| February 2025 | 5.93 | -0.001 | 37.31 | 0.4 % | 37.4 % | 672 h |
| March 2025 | 5.96 | -1.00 | 43.16 | 5.5 % | 46.2 % | 743 h |
| April 2025 | 5.99 | -0.60 | 47.95 | 9.6 % | 43.9 % | 720 h |
| May 2025 | 2.30 | -1.66 | 19.93 | 13.2 % | 62.0 % | 744 h |
| June 2025 | 2.34 | -2.14 | 37.64 | 17.5 % | 72.8 % | 720 h |
| July 2025 | 3.03 | -0.17 | 17.48 | 2.7 % | 23.9 % | 744 h |
| August 2025 | 6.93 | -0.63 | 58.67 | 5.0 % | 38.3 % | 744 h |
| September 2025 | 5.25 | -0.10 | 37.65 | 2.6 % | 34.9 % | 720 h |
| October 2025 | 6.14 | -0.01 | 57.24 | 3.0 % | 33.8 % | 745 h |
| November 2025 | 6.02 | -0.04 | 30.83 | 1.4 % | 28.2 % | 720 h |
| December 2025 | 4.51 | -0.005 | 21.57 | 1.9 % | 32.4 % | 744 h |
| January 2026 | 14.72 | 0.96 | 41.99 | 0.0 % | 0.3 % | 744 h |
| February 2026 | 17.22 | 1.39 | 77.05 | 0.0 % | 0.0 % | 672 h |
| March 2026 | 3.49 | 0.04 | 24.65 | 0.0 % | 20.7 % | 743 h |
| April 2026 | 6.21 | -0.07 | 23.62 | 1.4 % | 20.0 % | 720 h |
| May 2026 | 6.64 | -0.96 | 26.50 | 2.3 % | 16.8 % | 744 h |
| June 2026 | 5.69 | -1.00 | 28.55 | 1.6 % | 21.2 % | 720 h |
| July 2026 | 1.93 | -0.002 | 7.77 | 0.7 % | 28.3 % | 744 h |
| August 2026 | 5.18 | 0.00 | 25.41 | 0.0 % | 29.0 % | 744 h |
Closed calendar months only: a part-month average is not comparable with a full one. “Time covered” states the hours used; a month is published only when no more than one hour is missing. Known gaps are listed in the documentation.
“Negative” and “below 1 c” are shares of TIME, not of the number of stored values. From 1 October 2025 through 14 June 2026, the source API’s hourly value is the mean of four quarter-hours. Monthly averages remain comparable, but extrema and threshold shares in that interval cannot reveal individual quarter-hour extremes or signs. Prices are in cents per kWh and include the source’s applicable VAT.
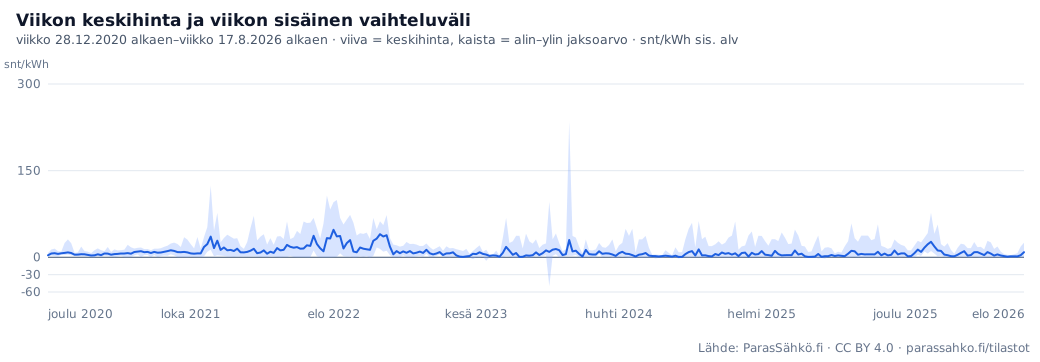
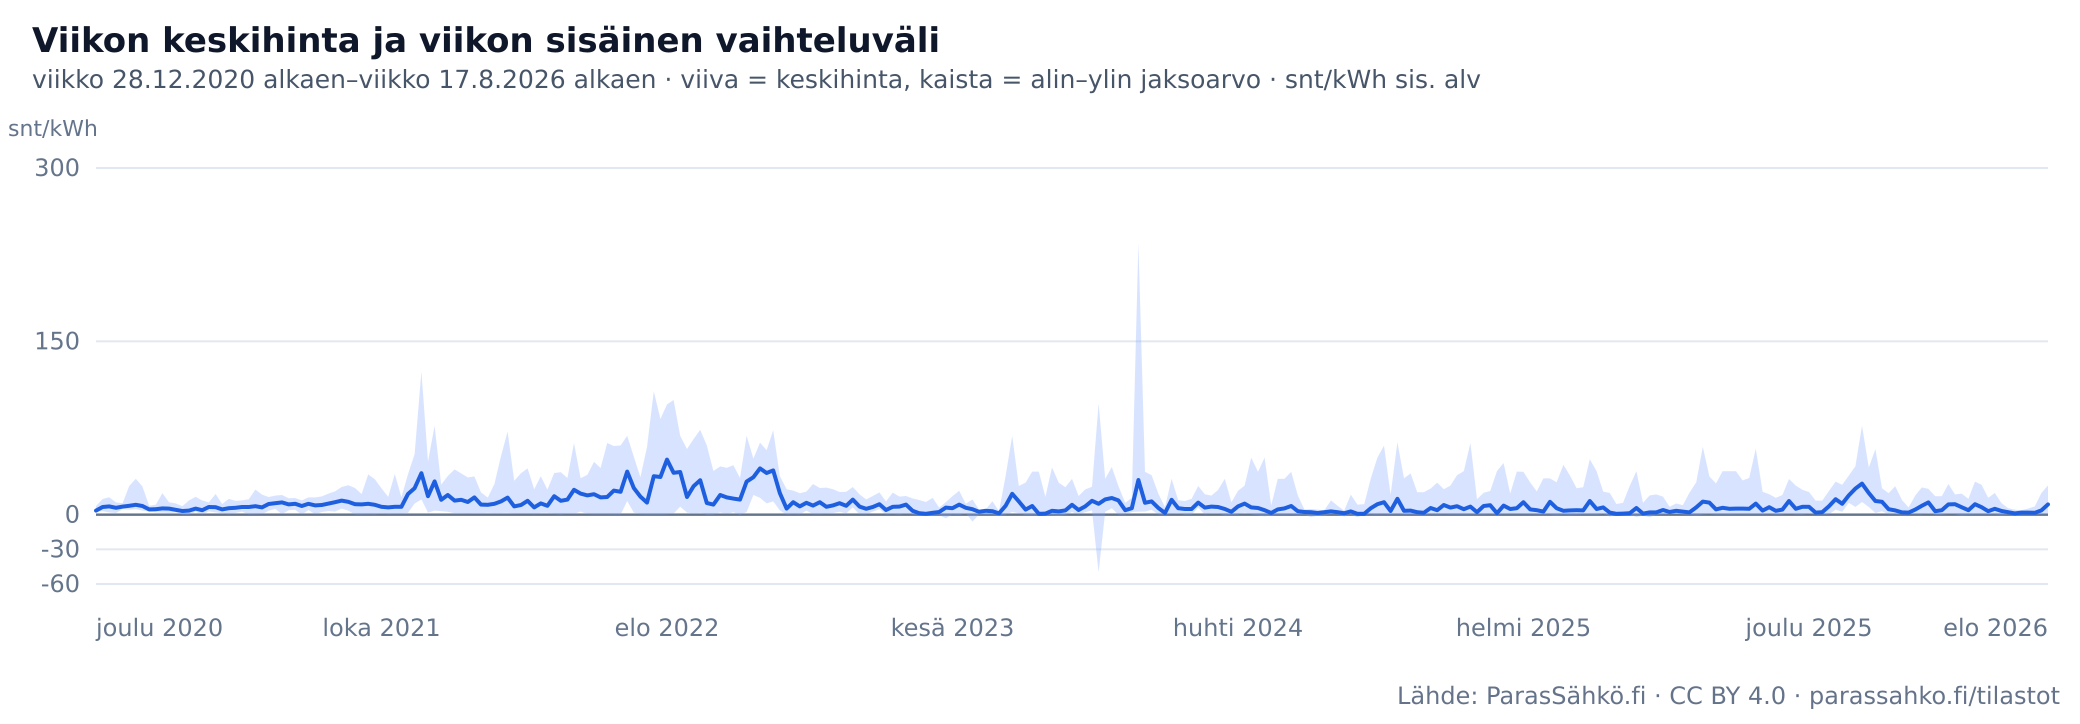
The range chart is weekly: the line is the week’s duration-weighted average and the band spans the week’s lowest and highest stored period value. Daily figures are in the daily CSV.
Time series
Yearly day-ahead averages
The same data by calendar year. The yearly average is weighted by period duration, not computed as the mean of monthly averages — February is a tenth shorter than January, so an unweighted mean would give it too much weight.
| Year | Average | Lowest | Highest | Negative | Below 1 c |
|---|---|---|---|---|---|
| 2021 | 8.97 | -0.14 | 124.01 | 0.1 % | 1.9 % |
| 2022 | 18.81 | -0.21 | 106.78 | 0.3 % | 4.3 % |
| 2023 | 6.68 | -50.00 | 96.37 | 5.3 % | 17.7 % |
| 2024 | 5.68 | -2.00 | 235.10 | 8.3 % | 28.9 % |
| 2025 | 5.08 | -2.14 | 58.67 | 5.2 % | 40.2 % |
| 20268 mo | 7.53 | -1.00 | 77.05 | 0.8 % | 17.2 % |
The current year is included, because it is usually the figure people ask for — but it is marked with its month count and is not comparable to a full year. Lowest and highest are the extremes of the year’s months, not of their averages.
Note when comparing: different years carry different VAT rates (24 %, temporarily 10 % from 1 December 2022 to 30 April 2023, and 25.5 % from 1 September 2024). A VAT-inclusive comparison of 2022 against 2026 is therefore not a clean price comparison. The series is downloadable as its own CSV.
Hour of day
At what times has electricity been cheapest on average?
Average price by clock hour across the whole series. The cheapest hour is 03:00 at 4.54 c/kWh and the most expensive 09:00 at 12.47 c/kWh. The highest hourly average is 2.7 times the lowest. Weekdays and weekends are separated so their profiles can be compared.
| Weekday (Mon–Fri) | 9.95 | c/kWh |
|---|---|---|
| Weekend (Sat–Sun) | 6.10 | c/kWh |
| Weekend cheaper by | 39 | % |
Hours are Finnish local time. These are averages across the whole series, not a forecast: on any single day the cheapest hour can fall anywhere. The weekday and weekend difference reflects the mix of days in this dataset; an individual weekday or weekend day need not follow the overall average.
15-minute settlement
Price varies within the hour too
The Nord Pool day-ahead market moved to 15-minute periods on 1 October 2025. The source API still supplied 60-minute prices to this dataset through 14 June 2026, so intra-hour variation can be analysed from 15 June 2026 onwards. Below is the spread between the priciest and cheapest quarter within the same hour, computed across 2,160 completed hours with all four quarters.
| Median | 0.75 | c/kWh | half of hours fall below this |
|---|---|---|---|
| Mean | 1.50 | c/kWh | individual spikes pull the mean up |
| 90th percentile | 3.94 | c/kWh | one hour in ten exceeds this |
| Largest observed | 17.57 | c/kWh | widest spread inside one hour |
| Spread above 1 c | 43 | % | share of hours |
Only completed hours with all four quarters present are counted, so a partially ingested hour cannot masquerade as a calm one. Market quarter-hours for 1 October 2025–14 June 2026 have not yet been backfilled into this dataset.
Extremes
Records in the series
The highest and lowest stored period value across the period covered by the data. These are not daily or monthly averages.
| Highest period value | 235.10 | c/kWh | 5 January 2024, 19:00 |
|---|---|---|---|
| Lowest period value | -50.00 | c/kWh | 24 November 2023, 15:00 |
Timestamps mark the start of the period, in Finnish local time. A negative spot price means the day-ahead energy price was below zero for that period. It does not automatically mean a consumer was paid: retailer margin, monthly fee, electricity tax and transmission can keep the total cost positive.
Market prices can turn negative when supply is abundant relative to demand. From 1 October 2025 through 14 June 2026, the stored hourly value is the mean of four quarter-hours rather than one quarter-hour quotation.
Market snapshot
Prices of contracts on offer
A cross-section of what is currently offered to Finnish consumers. For fixed contracts the figure is the energy price; for spot contracts it is the retailer’s margin on top of the exchange price. The table uses the ongoing list price; temporary campaign prices and monthly fees are excluded. Only products with a recorded source verification are included. Prices in these groups were source-checked between 11 September 2026, 04:30 and 13 September 2026, 12:05.
| Contract type | Products | Suppliers | Cheapest | Median | Most expensive |
|---|---|---|---|---|---|
| Spot (exchange-linked)margin c/kWh | 35 | 25 | 0.32 | 0.59 | 1.99 |
| Fixed, 6 monthsc/kWh | 9 | 9 | 14.33 | 15.50 | 16.67 |
| Fixed, 12 monthsc/kWh | 31 | 19 | 11.04 | 12.26 | 13.06 |
| Fixed, 24 monthsc/kWh | 31 | 21 | 9.68 | 10.60 | 12.04 |
| Fixed, open-endedc/kWh | 26 | 14 | 7.49 | 11.25 | 15.90 |
Covers comparable products generally offered to consumers. Consumption-effect and seasonal products are excluded because they have no single comparable energy price. The median is product-weighted, so separate tariff variants from one supplier count separately. Without monthly fees and campaign prices, this table cannot identify the cheapest contract overall.
It shows groups holding at least five products: a median and a range over one or two products say nothing about a market. 4 further products are on offer with terms of 9, 18, and 36 months. They are included in the JSON dataset, where every group appears with its product count.
Market time series
Price history of contracts on offer
Every morning this series records each comparable contract’s energy price or margin, monthly fee, campaign price and online orderability. The regulator’s price statistics describe currently offered products as monthly national weighted averages; this archive records prices at product level, daily. It currently holds 42 days and is extended each morning. The series exists only forward from the start of collection.
42 days in range. Each chart point is one day.
| Contract group | Latest | Change | Lowest | Highest | Days | Products |
|---|---|---|---|---|---|---|
| Spot margin | 0.32 | -0.07 | 0.32 | 0.39 | 42 | 35 |
| Fixed 6 mo | 14.33 | +2.41 | 11.92 | 14.33 | 42 | 9 |
| Fixed 12 mo | 11.04 | +0.85 | 10.19 | 11.04 | 42 | 31 |
| Fixed 24 mo | 9.68 | +0.35 | 9.33 | 9.68 | 42 | 31 |
| Fixed, open-ended | 7.49 | +0.55 | 6.94 | 7.49 | 42 | 26 |
Figures are c/kWh including 25.5 % VAT — for spot contracts the retailer’s margin on top of the exchange price, for fixed contracts the ongoing list price excluding campaign discounts and monthly fees. A break in a line means no products in that group on those days. A move in the series can come either from a repricing or from a change in the comparable set: a product can be withdrawn, or reclassified into a pricing model that leaves the set (consumption-effect and seasonal products are excluded, having no single comparable energy price). The table’s “products” column states how many products the group held on the range’s last day, and is worth reading beside the price.
The table’s lowest and highest are always read from daily values, even when the chart draws a long range as weekly or monthly averages. The machine-readable range query is at /tilastot/sopimussarja.json (parameters alkaen and asti). The derived series starts on 2026-08-03, when the comparability criteria were tightened (delivery-obligation, regionally restricted and package-priced products were removed); earlier archive days from 2026-07-30 are included in the CSV archive marked criteria_version=1 but excluded from the series, so a methodology change cannot masquerade as a market move. Campaign-price fields accrue from 2026-08-04. The full product-level archive is downloadable below.
Coming: monthly series
Spot vs. fixed realised-cost index
From September 2026 this page publishes a monthly comparison: what spot electricity cost typical consumption profiles in the closed month, and what the same month’s cheapest offered fixed-term contract would have cost. The method is fixed in advance and is not adjusted based on the results.
Pre-registered method:the spot realisation is computed from the month’s quarter-hour/hourly prices weighted by a consumption profile (apartment 2,000 kWh/yr, detached house 18,000 kWh/yr with electric heating; the profiles are models, not measured usage), plus the month’s cheapest offered spot margin and monthly fee.
The fixed benchmark is the same month’s cheapest offered 12-month fixed list price with its monthly fee, from this page’s contract-price archive (from 2026-08-03). All prices include 25.5 % VAT; transmission and electricity tax are excluded. The first index point covers August 2026, published once the month has closed with a full archive.
Ready-made images
Download and embed the charts
The page’s charts are available as finished image files with the attribution inside the image. They may be republished as-is, including commercially (CC BY 4.0), or redrawn in your publication’s own style. The images are generated from the same data as the page’s charts and update automatically. Chart labels are in Finnish.
The monthly chart can also be embedded; it always shows the newest data:
<iframe src="https://parassahko.fi/embed/kuukausikaavio"
  width="100%" height="400" style="border:0" loading="lazy"
  title="Pörssisähkön kuukausikeskiarvot – ParasSähkö.fi"></iframe>
Machine-readable
Endpoints and downloads
Each series has its own stable URL. All of them allow browser requests (CORS) and carry a licence header, so they can be called directly from an application or a notebook. The files are language-neutral: their column names are already in English.
| URL | Contents | Rows |
|---|---|---|
| /tilastot/data.csv | Monthly averages, extremes and shares | 68 |
| /tilastot/vuosittain.csv | Yearly averages, extremes and shares; a partial year is flagged | 6 |
| /tilastot/paivittain.csv | Daily averages and daily extremes | 2081 |
| /tilastot/tunnit.csv | Average price by hour of day, weekday and weekend | 24 |
| /tilastot/sopimushistoria.csv | Product-level contract archive: prices, campaigns and orderability, daily | 8287 |
| /tilastot/sopimussarja.json | Contract-group daily series for a chosen range (parameters alkaen and asti); a long range collapses to weekly or monthly points | – |
| /tilastot/data.json | All published statistical series plus metadata: provenance, licence, coverage, unit, VAT basis and the dataset changelog | – |
| /en/statistics/README.md | Documentation: column definitions, method and limitations | – |
CSV files use a comma as the field separator and a dot as the decimal separator. An empty cell means no observations — zero is a price, not missing data. The spot downloads contain derived statistical series, not raw period-level records; the contract-history file is a product-level archive. Responses are cached for one hour and are free to use with attribution.
Method
Where the numbers come from
Source chain. The day-ahead market for the Finnish price area is operated by Nord Pool. Price rows are obtained through the Porssisahko.net API and compiled in ParasSähkö.fi’s database. This is not an independent measurement or a direct Nord Pool feed.
Collection. Hourly history for 15 June 2025–14 June 2026 was backfilled from the Porssisahko.net v1 history endpoint on 15 June 2026, and the earlier history from 1 January 2021 from the same source on 4 August 2026. Quarter-hour prices from 15 June 2026 onwards are collected from the v2 endpoint after publication.
Historical cutoff. Statistics include completed delivery periods only, and daily figures end at the last complete Finnish calendar day. Day-ahead prices already published for tomorrow do not enter realised history.
Time zone. Months, days and hours are computed in Finnish local time (Europe/Helsinki), so daylight saving is accounted for.
VAT. Prices include the legal Finnish VAT of each delivery day: 25.5 % from 1 September 2024, 24 % before that — except 1 December 2022 to 30 April 2023, when electricity VAT was temporarily 10 %. Negative prices carry 0 % VAT. Prices from different years thus embed different VAT rates. Electricity transmission and electricity tax are not included, because they are not set on the exchange and cannot be changed by switching retailer. The source API applied a wrong rate to 77 hours (30–31 August 2024; 1 May 2023 00:00–01:00; and negative prices before December 2022, which the source taxed although negatives carry 0 %); they were re-based to the legal rate at import, tagged with their own source identifier in the data, and verified hour by hour against VAT-free references. Two hours missing from the source were filled from Elering’s open Nord Pool series, making coverage complete.
Weighting. Averages are weighted by period duration, because the series contains both hourly and quarter-hourly periods. An unweighted mean would give a quarter-hour four times the weight of an hour.
Version history
What has changed in the dataset
This dataset has changed retroactively more than once: the history has been extended backwards and the upstream source’s VAT errors have been corrected. A figure published earlier may therefore differ from the same figure today, and that has to be stated — otherwise citing the dataset is guesswork. If you have published a figure from this data, check here whether a change touches it.
21 August 2026
Contract identity stabilised — contract_slug changed
The contract identifier embedded the Finnish Energy Authority's price-version id, and the authority mints a new id every time a product's price changes. The same product therefore received a new contract_slug on every price change: Imatran Seudun Sähkö's Voima 12 kk appears in the archive under four different identifiers within three weeks. The identifier is now derived from the supplier and the product name, and historical rows have been merged back under it.
Affects already-published figures: All contract-history data (sopimushistoria.csv and sopimussarja.json) downloaded before 21 August 2026: contract_slug values have changed, and rows belonging to one product previously looked like several distinct products. If you analysed per-product price development or product churn, recompute it — churn appeared several times higher than it was. Prices, dates and other fields are unchanged. In the Zenodo archive the old scheme is in versions up to 4 August 2026 (10.5281/zenodo.21781098 and earlier); the corrected scheme is in the version of 25 August 2026 (10.5281/zenodo.22090078) onwards.
4 August 2026
Price history extended back to 2021
The series previously began on 15 June 2025. History from 1 January 2021 was backfilled from the Porssisahko.net v1 history API, growing the dataset from roughly four months to over five years.
Affects already-published figures: All extreme-value and superlative claims. The cheapest month changed: August 2024 (1.57 c/kWh) is lower than any month in the earlier window. If you published a claim of the form “the lowest in the dataset” or “the highest on record” before 4 August 2026, it needs rechecking.
4 August 2026
77 hours restored to their statutory VAT rate
The upstream API had applied the wrong rate: 48 hours on 30–31 August 2024 (25.5 % before it took effect), one hour on 1 May 2023 (10 % after the temporary period ended) and 28 negative hours before December 2022 (VAT added although the rate on negative prices is 0 %). The rows carry their own source tag and were verified hour by hour against VAT-free reference sources.
Affects already-published figures: Monthly averages for August 2024 and May 2023, and the distribution of negative prices before December 2022. The changes are small but they are real.
4 August 2026
Two hours missing upstream were filled from Elering
One hour was missing on 1 January 2021 and one on 15 June 2026. Both were taken from Elering's open Nord Pool series and the statutory VAT for each day was added. Coverage is complete after this.
3 August 2026
Contract register criteria version 1 → 2
Promotional-price and orderability fields were added to the contract archive, so the derived group series begins on 3 August 2026. Earlier days are in the archive but without these fields.
Affects already-published figures: The daily contract-group series (sopimussarja.json) before 3 August 2026 — it starts on that date, not on the archive's first day of 30 July 2026.
30 July 2026
Contract price archive begins
First product-level daily snapshot of which electricity contracts were offered to consumers and at what price. The archive only accrues forward: it cannot be backfilled, because what was on offer was not recorded before this date.
15 June 2026
Quarter-hourly prices enter the dataset
The upstream v2 API began delivering 15-minute prices. The market itself moved to 15-minute settlement on 1 October 2025, so between 1 October 2025 and 14 June 2026 an hourly value in this dataset is the mean of four quarters.
Affects already-published figures: Minima, maxima and threshold shares over that window: they do not reveal individual quarter-hour extremes or their sign. Monthly averages remain comparable.
The dataset accrues forward daily; only changes affecting already-published history or the dataset’s structure are logged here. The version DOI that identifies a frozen snapshot is unaffected by any of them — that is precisely what it is for.
Terms of use
How to cite
These statistics may be published, quoted and used freely, including commercially, as long as the source is credited. The licence is Creative Commons Attribution 4.0. Cite the live page for the current, updating dataset. The version DOI below is only for the earlier immutable Zenodo (CERN) snapshot.
ParasSähkö.fi: Finnish electricity price statistics. https://parassahko.fi/en/statistics (accessed 2026-09-13).
Pasanen, I. (2026). Suomen sähkön hintatilastot [Data set]. Zenodo. https://doi.org/10.5281/zenodo.21701225
Pasanen, I. (2026). Suomen sähkön hintatilastot (archived snapshot 2026-08-25) [Data set]. Zenodo. https://doi.org/10.5281/zenodo.22090078
Contact: info@parassahko.fi. The dataset is produced by Funky Labs Oy (business ID 3628630-3), Finland.